

AI Solutions for Always-Optimized Operations
Benchmarking Agent Optimizers: A Path to Self-Optimization

Following up on our announcements on Agentune and Agentune-Simulate, we expand here on how to evaluate and benchmark agent optimizers, extending our work on benchmarking insight discovery from late 2024.
Today we are releasing a 3-component package for evaluating insight-discovery tools/agents:
- A github repository implementing the benchmark evaluation framework and the python package
- A benchmark curriculum folder containing insight-discovery problems and ground-truth insights.
- A python package insight_eval on pypi
We believe that operational AI agents in general, and customer-facing AI agents in particular, can and should be improved over time. Equipped with GenAI optimization tools, there is no reason they should not evolve even more effectively than top-performing human agents do.
To realize this vision, we focus on operational AI agents that are designed and built with a KPI at mind, and in many cases a combination of KPIs.
This article is about two different layers related to evaluating agent optimization:
- How to evaluate the agent wrt its KPIs
- How to evaluate an agent-optimization technology
Highlights
Together with this article, we are releasing the benchmark curriculum version 1.1, composed of 197 problems with ground truth, each including the problem specification as well as the problem data. The ground truth, includes in addition to the insights to be discovered, the enriched data with the computed values associated with the insights.
The new benchmark repository addresses feedback on problem composition and the need for greater difficulty variation. This version's problems offer wide variety across several dimensions: associated use case, number of insights to be discovered, number of data tables, number of columns in the primary table, strength of insights relative to the target, and empirical problem difficulty. We focused on fewer problem domains to achieve higher richness within domains and keep the total number of problems under 200.
We are also expanding the evaluation framework that was introduced in the first version.
In order to avoid confusion in terminology, we will be referring to agents when we talk about operational customer-facing agents, and to insight-discovery-tools when we talk about such tools used for agent optimization.
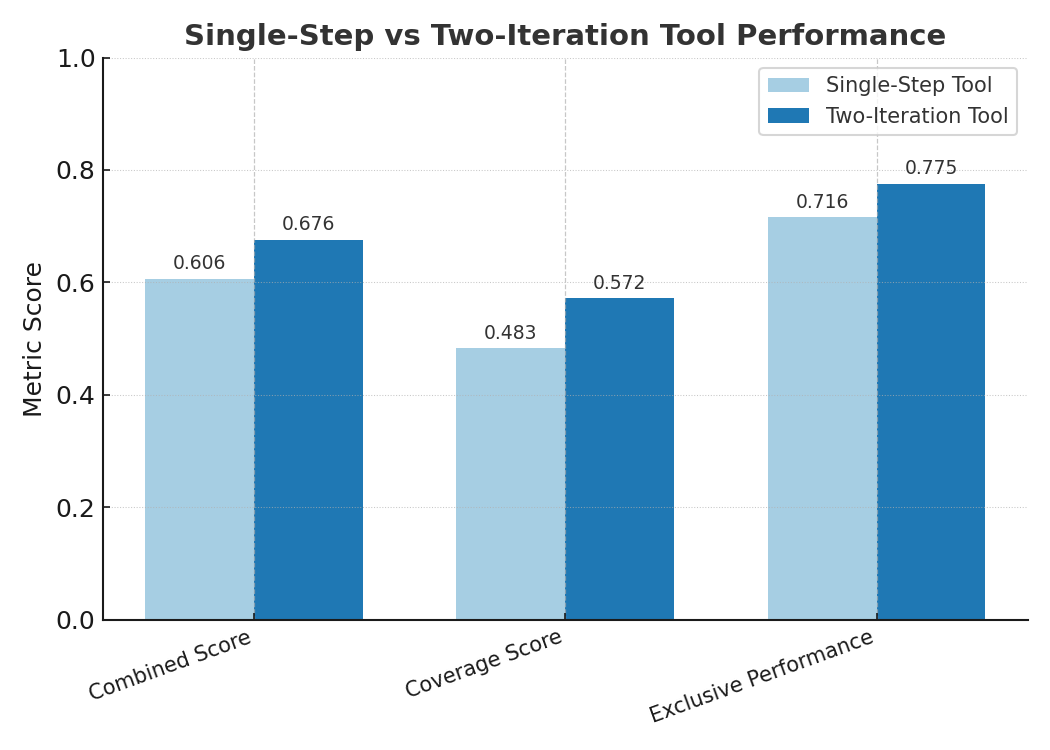
Our focus is on understanding and evaluating LLM-based tools for insight discovery, specifically their strengths and limitations. To illustrate, we compare the performance of two insight-discovery tools on benchmark problems:
Both tools, Single-Step and Two-Iteration, attempted 197 problems, and provided 189, 190 solutions respectively. However the number of valid solutions is significantly different 186 (Single-Step) vs 149 (Two-Iterations).Below you can see that the two-iterations tool performs ~10% better than the simpler one.
More details in the Insight Discovery Evaluation section below.
1- Recap of the Benchmarking LLMs Insight Discovery article
🛠️ The first version of the benchmarking evaluation framework for insight-discovery outlined a novel approach composed of 2 components:
- A dynamic benchmark of insight-discovery problems, including data and ground-truth insights
- An evaluation framework for insight discovery capabilities in AI agents
The key challenges the framework is addressing are:
- Create clarity and distinction between problem specifications, problem data, and ground-truth insights.
- Handle multi-table data, beyond the primary data table, secondary tables provide important information
- Benchmark problems should be attached to a set of ground-truth insights; these insights are to be seamlessly planted in the data.
- Provide effective metrics to evaluate an AI agent attempting the task of insight-discovery over the benchmark.
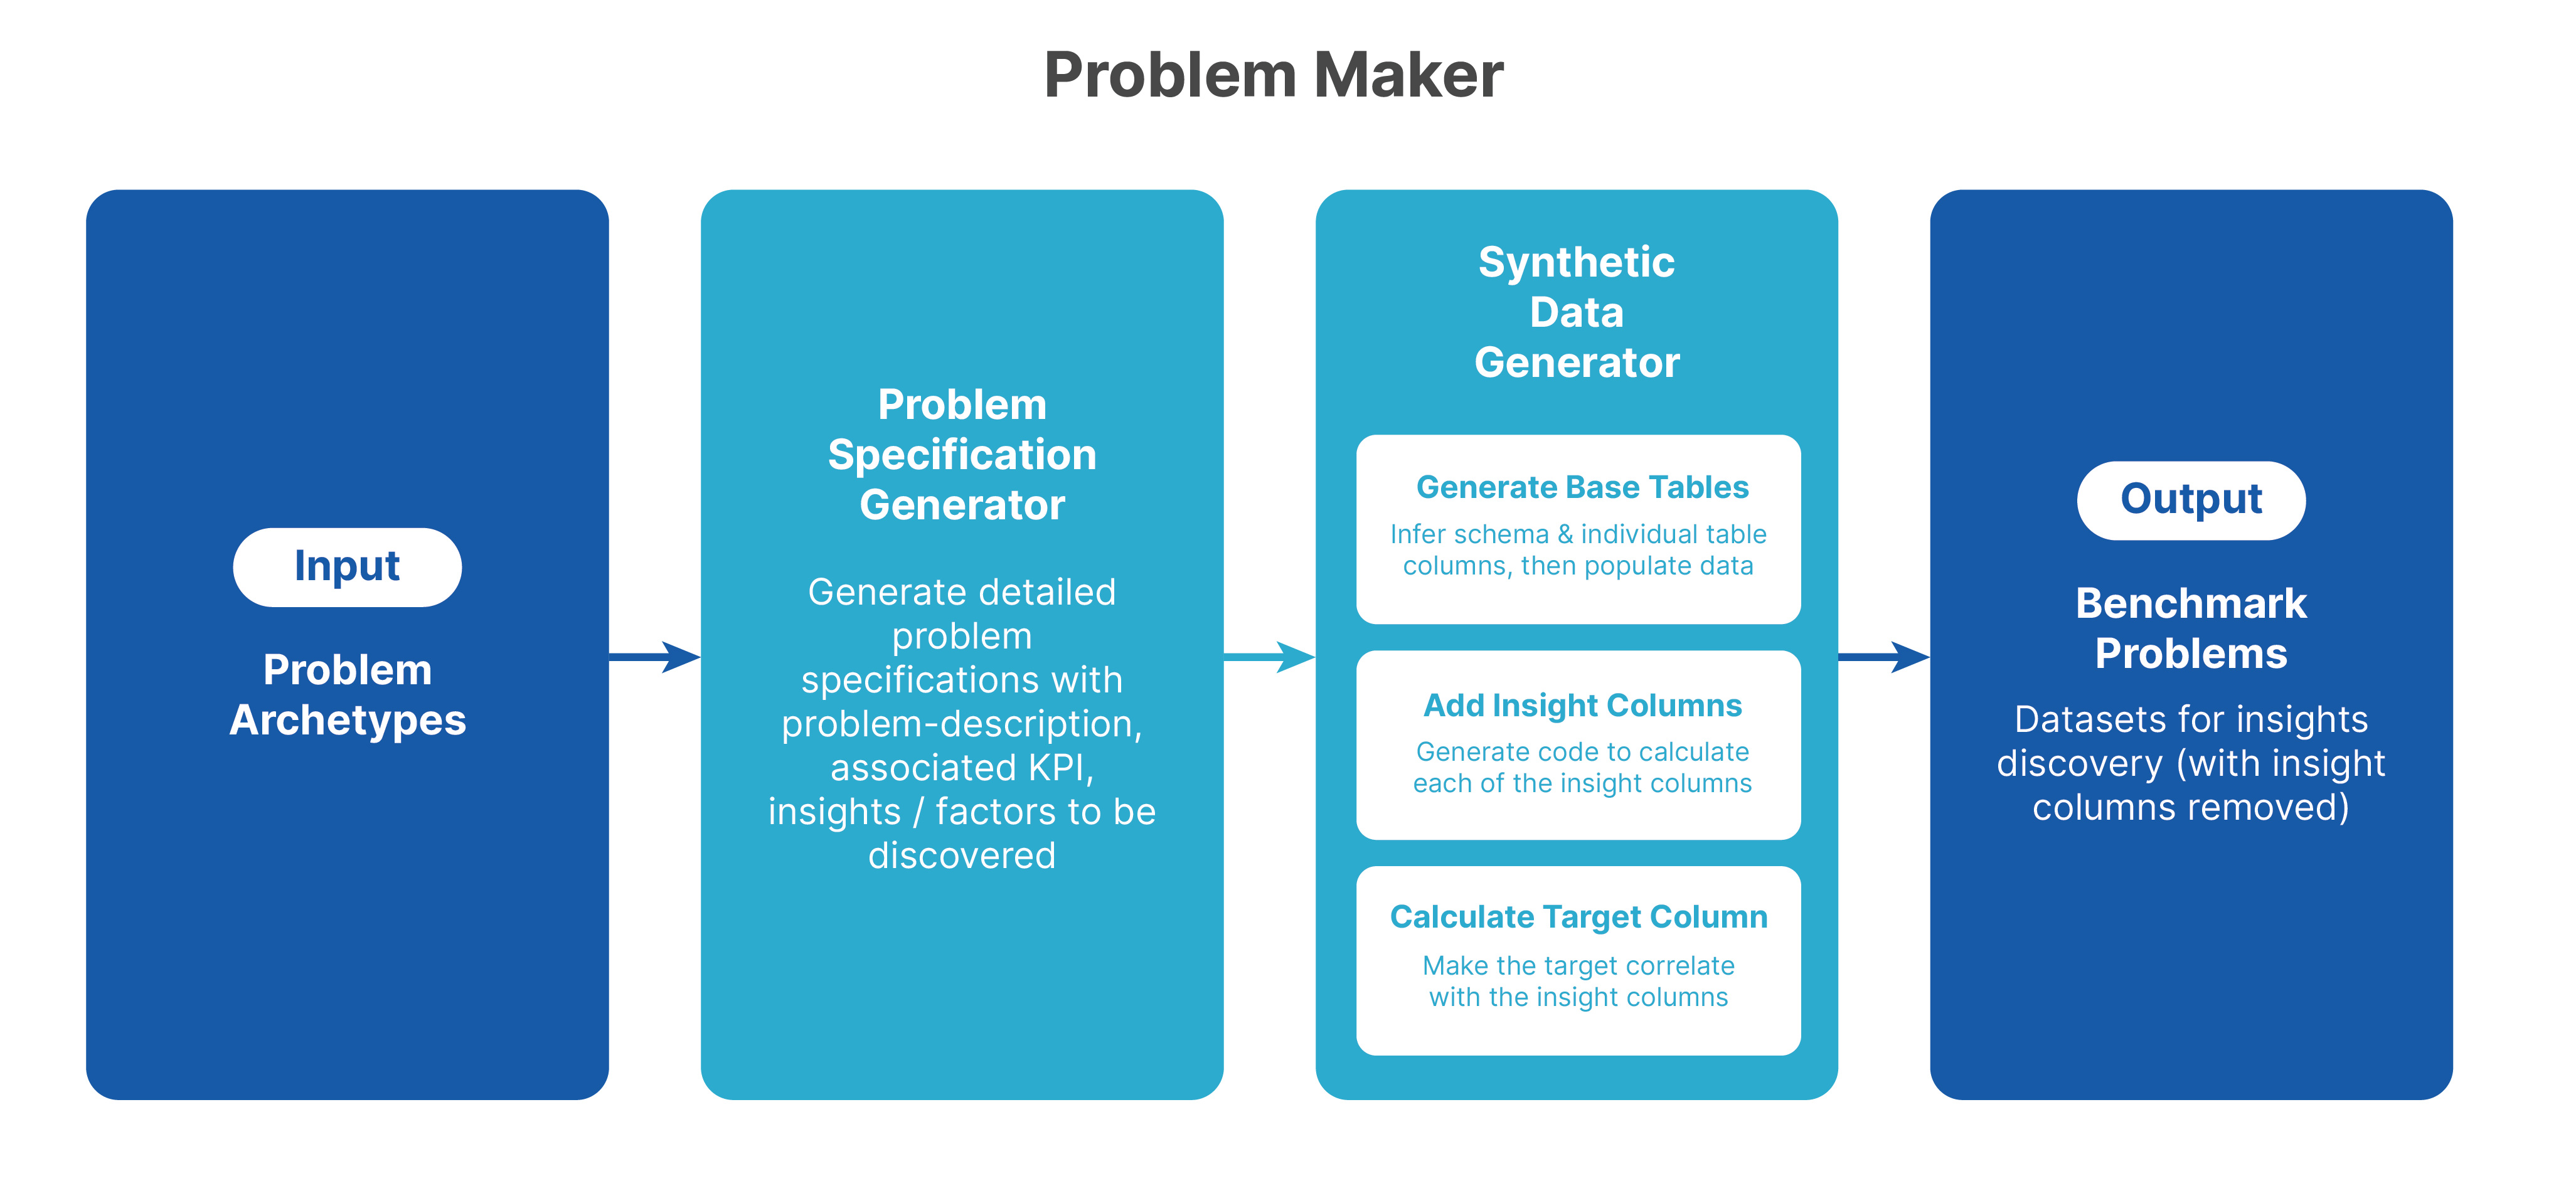
We outlined a system to automatically generate insight discovery problems, and attached a sample set of benchmark problem specifications. We did not attach problem data nor code for evaluation. These are part of today’s release.
Reminder, a problem specification provides the elements required to generate a benchmark problem instance (data and metadata) :Problem name, Problem domain, Problem description, Required tables (and indication of the primary table, Target name, Insights to be discovered, Comments (for data, target and schema).
Finally, the article described a design of a dynamic benchmark generation system, that automatically generates problem specifications, and then problem and ground truth data.
2- On Agent Evaluation and Optimization
To optimize an agent, whether it’s a sales agent optimizing conversion rates and order values, or a support agent increasing resolution rates and reducing resolution times, we systematically apply the cycle below to continuously drive agent KPIs to the desired direction.
(Evaluate → ) Analyze → Improve → Evaluate

That is, we measure the KPIs for the current behavior of the agent, analyze what is driving each KPI up or down, and then propose decisions and actions to improve each KPI on its own and an overall KPI in case some of the KPIs are conflicting with each other.
A common evaluation approach is creating a reference benchmark and evaluating the agent against it, BUT how do you create a benchmark in a setup where every response of the agent changes the customer response? A static benchmark, even if custom-built for the use case, would not do the job. The same holds for historical data, labeled or unlabeled.
Last week, we announced Agentune-Simulate, empowering teams to iterate confidently toward better-performing agents. It enables builders to test new agent versions safely within realistic, context-specific, yet use-case relevant simulations before going live.
Agentune-Simulate provides, together with the conversation simulation, an indication of its outcome; the distribution of these outcomes is what’s needed to recalculate the operational KPIs of the agent. Thus, this constitutes the Evaluate component in the optimization cycle.
Later in 2025, we will release Agentune-Analyze, and Agentune-Improve will follow early 2026.
This brings us to the second question - how could one evaluate such agent-optimization technology?
3- Evaluating Agent Optimization
As we expect agents to continuously improve over time, we are logically bound to expect a technology optimizing agents to continuously improve as well. Therefore, we choose to apply the optimization cycle: Evaluate → Analyze → Improve → Evaluate to our own development process.
This is exactly what we started last year, and continued this year. The benchmark we present today is still mostly focused on analyzing and finding insights in structured operational data. We have not yet included problems associated with customer-facing agents use-cases, and in particular the logs of the conversations carried out by such agents.
As we continue to develop the benchmark, we will make the adjustments needed to address metrics related to the conversational data, and incorporate the Agentune-Simulate component to assess candidate agents.
As mentioned above, today’s release includes an expansion of the initial version of the evaluation framework introduced last year (aka V0). One of the dimensions the new benchmark version improves on the previous one is problem difficulty. In the next section we explain how we assess problem difficulty and provide various statistics of how problem difficulty varies by multiple problem attributes.
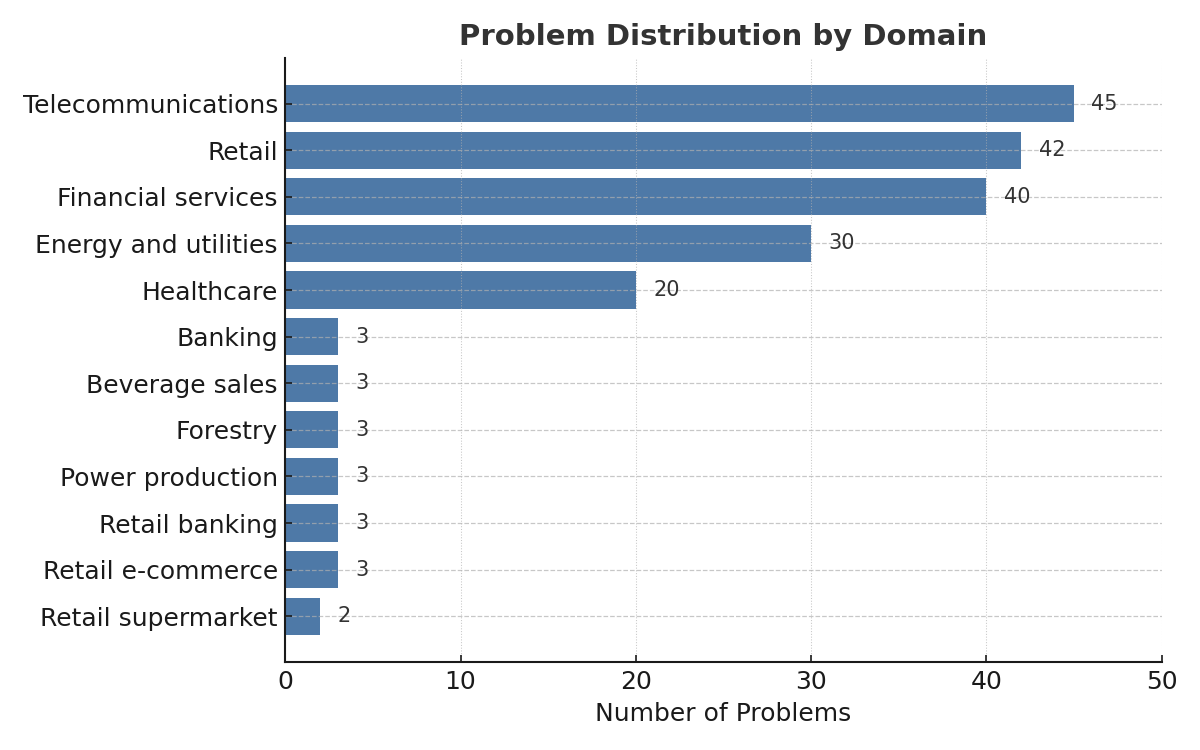
4- Distribution of Problems
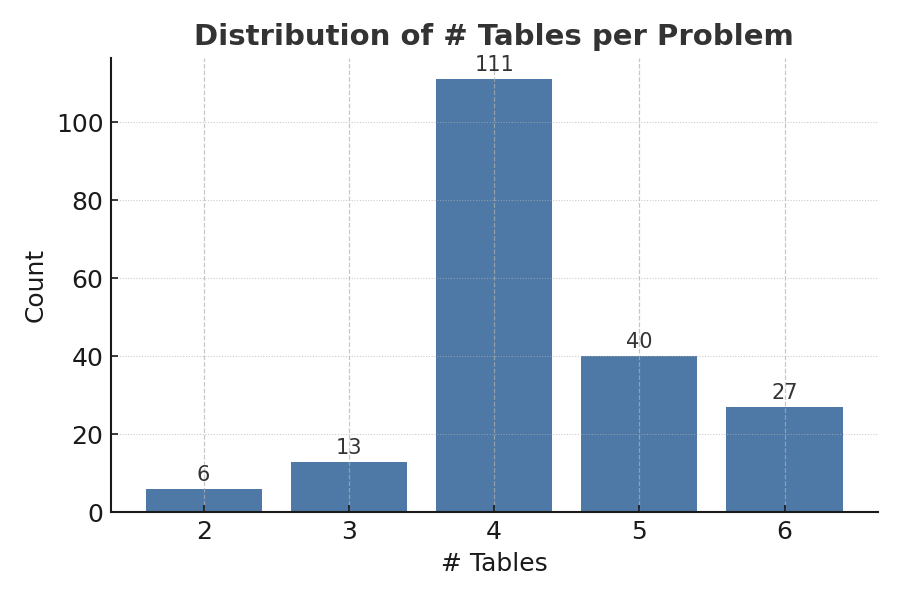
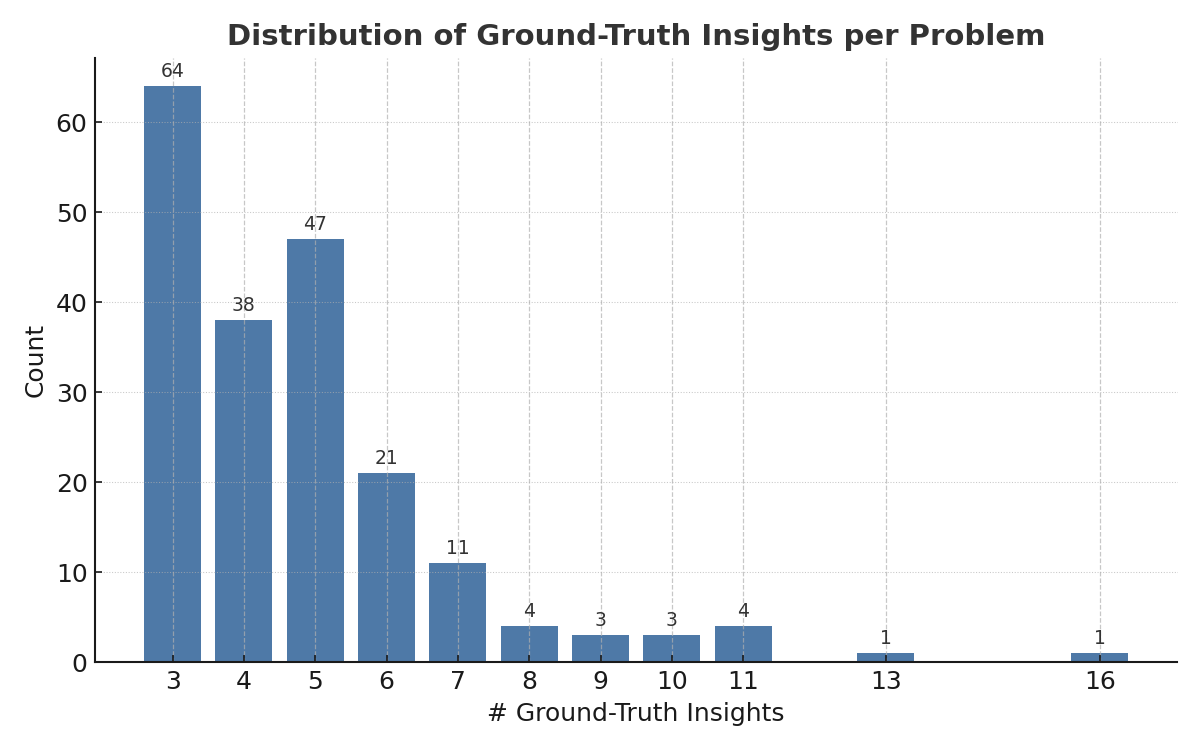
The problems in this version have a wide variety in several dimensions: associated use case, problem domain, number of insights to be discovered, number of data tables, number of columns in the primary table, number of ground-truth insights to be discovered, and the strength of these insights wrt the target.
Note: the benchmark data is available here, where you will find two directories:
- problems
- agents_solutions
When generating the problems, we also wanted to have variety in the strength of the signal the ground-truth insights have wrt the target. Each problem has up to 3 target variations, differing only in the target column.
The target columns were generated using two computation models:
- Logistic (Type 1)
- Linear (Type 2)
each paired with one of three signal strengths:
- Balanced (a), where all insight patterns have similar signal weights
- Weakly Biased (b), where one of the patterns is weakly biased
- Strongly Biased (c ), where one of the patterns is strongly biased.
As a result problems are named with the following convention:
P[#]-[problem_name]-variation_[#]-type_[#][a|b]
Example: P6-Customer Churn Prediction-variation_2-type_2b -> (this one is Linear and Weakly biased)
Below we show the different frequency distributions with respect to several different problem attributes. Later, when we explain problem difficulty estimation, we also show how problem difficulty varies by different attributes
Note that out of the 200+ problems in V0, we kept 29 problems. We chose to focus on fewer problem domains, with the intent to have higher richness within domains and keep the number of problems under 200.
5- Evaluation Metrics - V1.1
The new evaluation framework (Insight-Eval) expands on the metrics we introduced last year. While keeping the major evaluation categories:
- Coverage,
- Predictive Performance (which we also referred to as Statistical Power), and
- Proper Use of Data
We observed that Correlation Coverage does not always reflect the true extent to which the ground-truth insights are captured by the solution. Specifically, when a discovered feature captures the essence of a ground-truth feature but does so via a non-monotonic mapping, neither the Pearson nor the Spearman correlation would adequately reflect this relationship.
To address this, we explored a variety of additional coverage metrics. In this release, we introduce several of these new metrics:
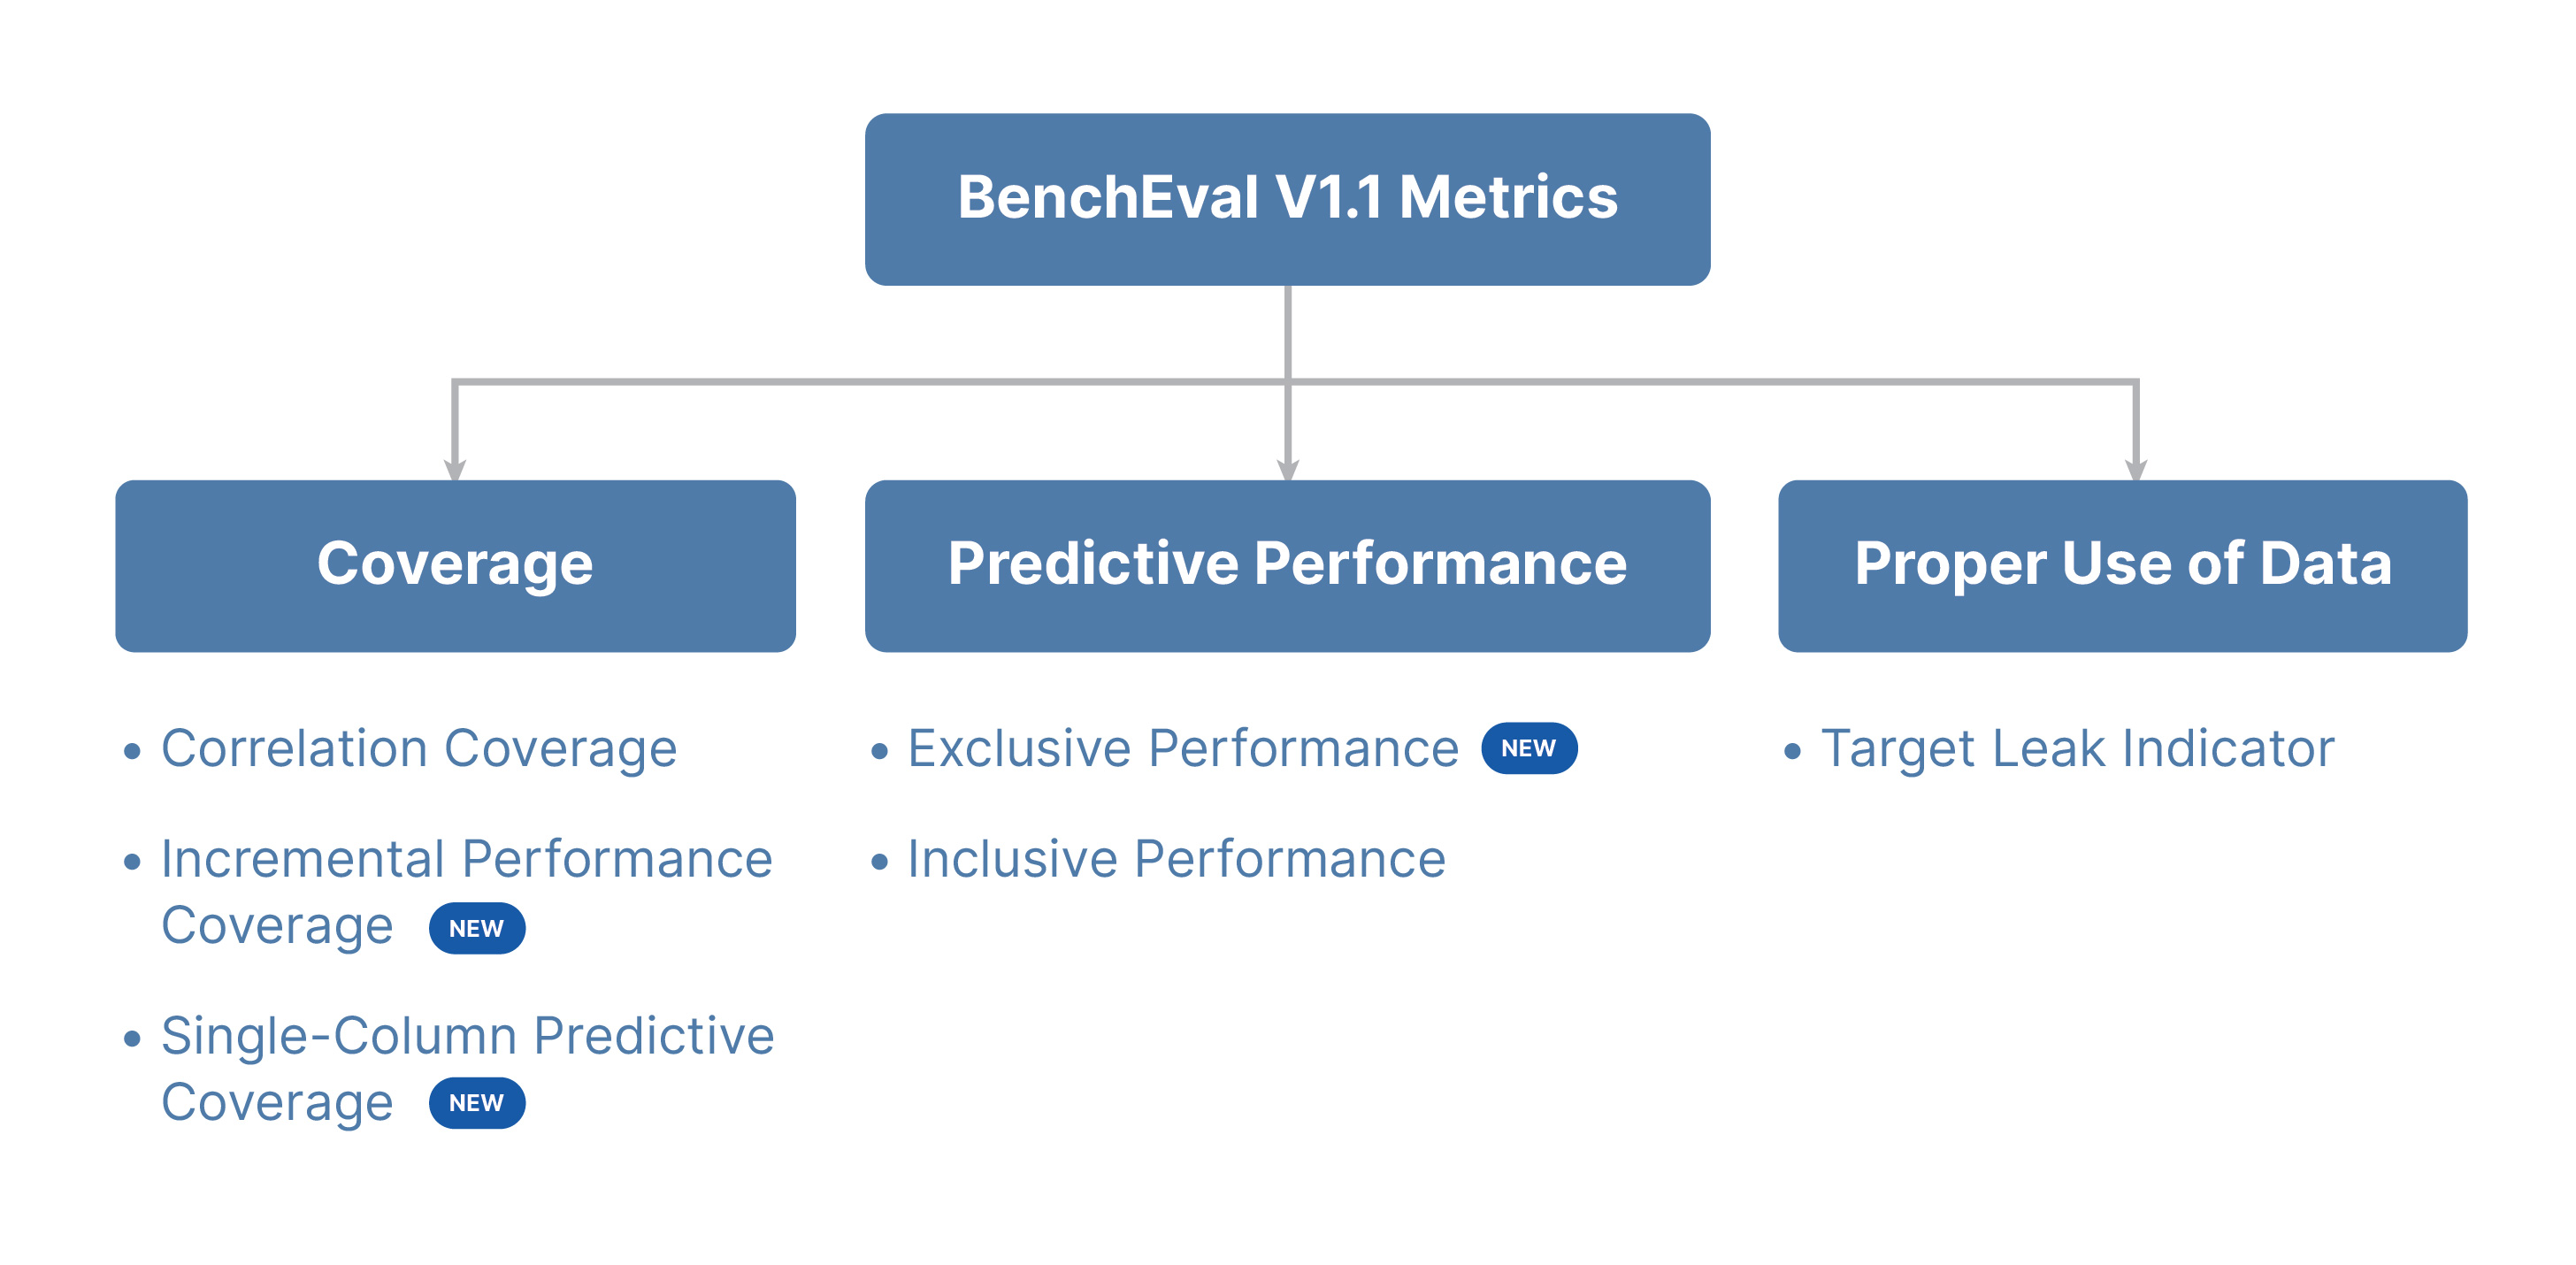
- Coverage:
- Incremental Performance Coverage
- Single-Column Predictive Coverage
- Predictive Coverage
- Correlation Coverage (already part of V0)
- Predictive Performance
- Exclusive Performance
- Inclusive Performance (already part of V0 as Predictive Performance /Statistical Power)
Analyzing the overlap and signal dominance across these metrics, we identified the following two metrics as the most effective:
- Incremental Performance Coverage
- Single-Column Predictive Coverage
In addition to these two metrics, we introduce a holistic Coverage Score, defined as a weighted average of these two metrics, with respective weights of 0.3 and 0.7.
Detailed description of the new evaluation metrics is provided in Evaluation Metrics
6- Summary of Tool Evaluation
- We use the evaluation framework introduced in our late 2024 article, and we add several evaluation metrics for robustness.
- We refer to the single-step-tool that we also introduced last year. It is based on a single prompt for generating insight candidates + python code to execute them, and a non-LLM component for selection of the insights based on their performance wrt the target on a holdout sample).
- The second tool performs two iterations over the single-step procedure, then it merges the results to get the best insight candidates (again by evaluating on a holdout sample).
As expected the two-iterations approach is better than the single-step approach when evaluated on a test set (unobserved by the tools). We also observe that tools performance varies by problem, thus concluding that
7- Problem Difficulty
We introduce an empirical problem difficulty metric, based on evaluating both of the illustrative tools on a problem wrt the evaluation metrics introduced in section 4.
We leverage the two insight-discovery prototypes mentioned in section 5 to estimate the difficulty of problems in the benchmark.
We identified key performance and coverage metrics and assigned difficulty ranges and importance weight for each.
Thresholds
Performance thresholds: 0.6, 0.7, 0.8, 0.9
Coverage thresholds: 0.1, 0.2, 0.4, 0.6, 0.75
Weights:
Exclusive performance: 0.4
Mean correlation coverage: 0.0
Min incremental performance coverage: 0.18
Mean predictive coverage: 0.0
Mean single column predictive coverage: 0.42
The difficulty formula takes into account the minimum and maximum of each metric for both tools (single-step and two-iterations)and assigns a score in[0,1] according to the thresholds above. It then averages the minimum and maximum scores for each metric, and calculates the weighted average of the scores wrt the weights defined above. This is the overall difficulty score.
The detailed computation is taking place by the function estimate_problem_difficult in repo_eval_stats.py.
The difficulty score is mapped to a qualitative difficulty level: very easy, easy, medium, hard, very hard.
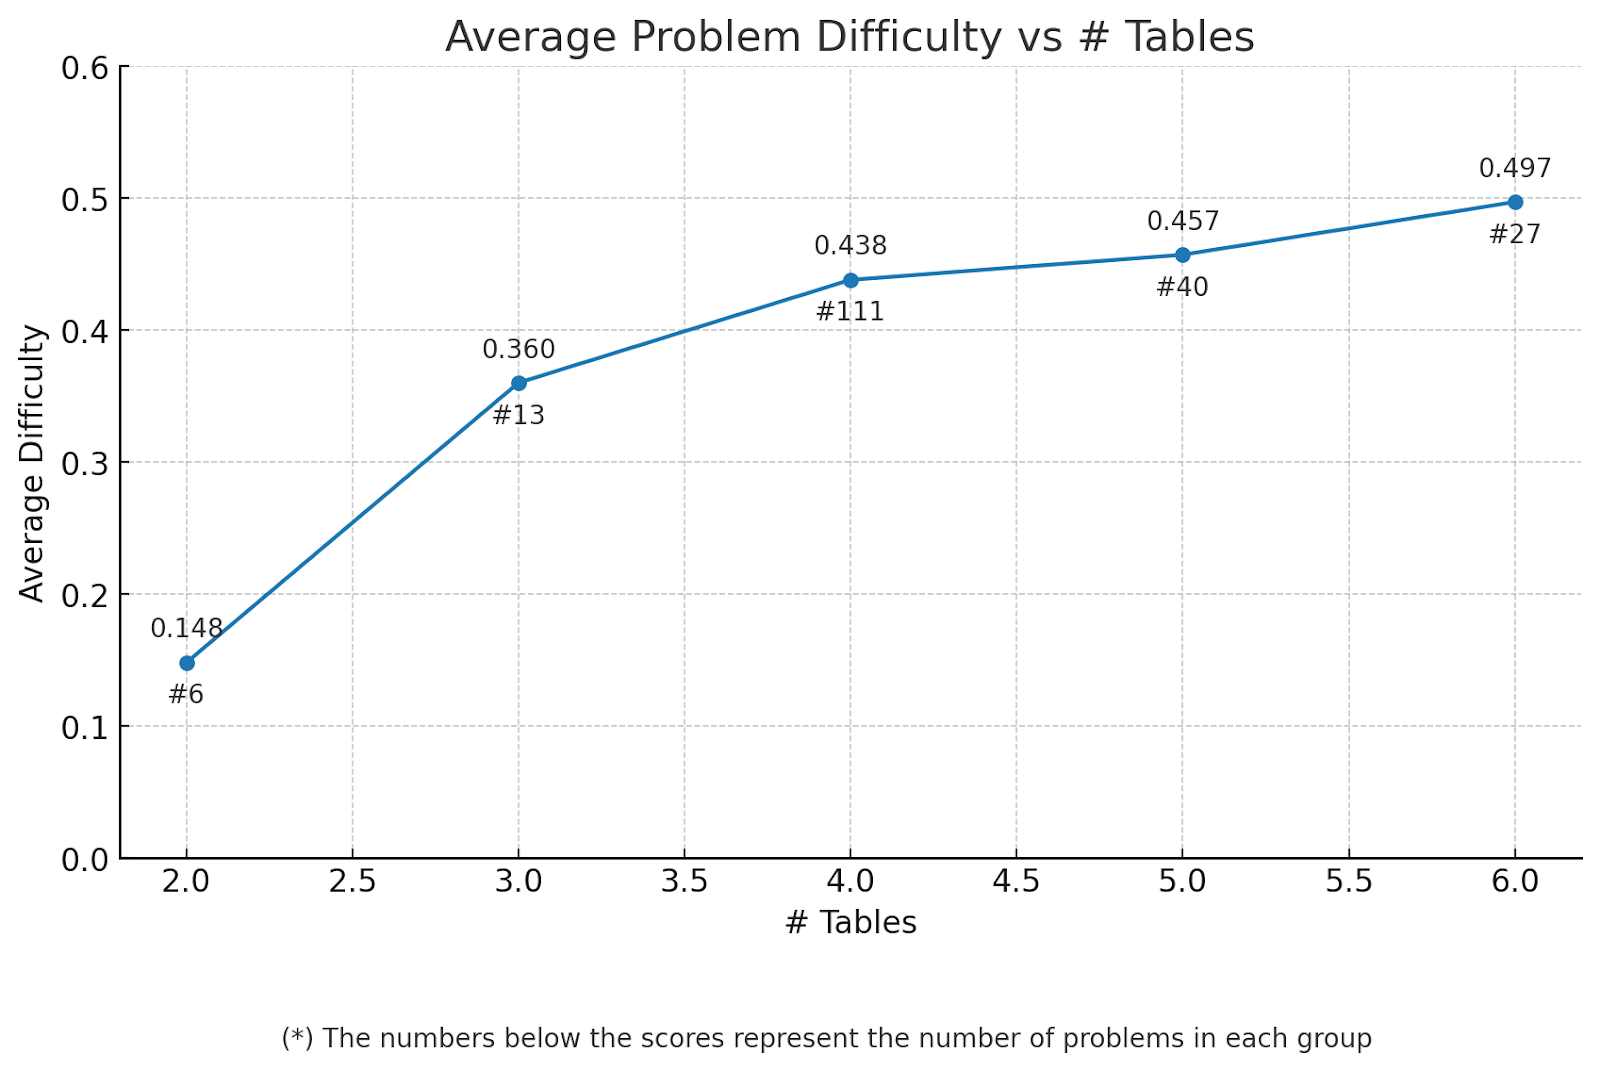
The below tables show how problem difficulty varies by different problem attributes.
Difficulty typically increases with the number of tables with the most significant impact is from 2 to 3 tables and 3 to 4 tables
It appears that problem difficulty does not significantly correlate with the problem domain.
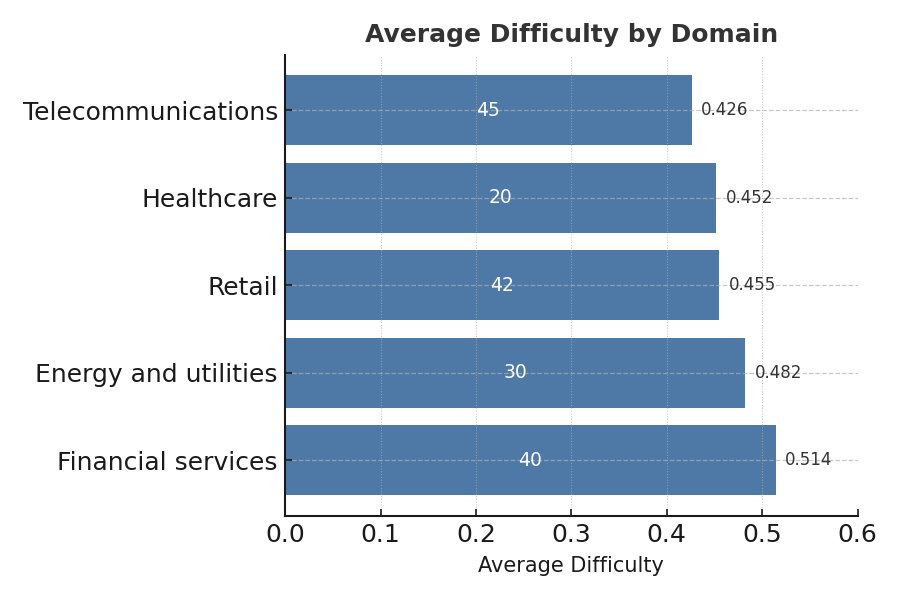
(*) domains with low representation were omitted
8- Next steps on Agentune & Towards Self-Improving Agent Optimization
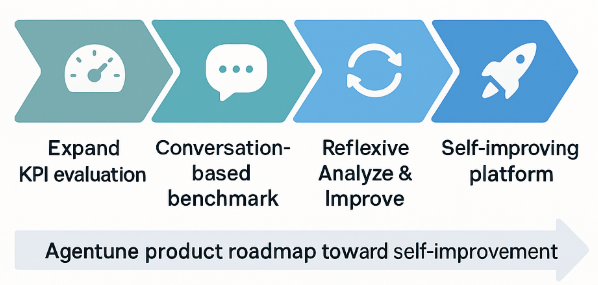
As we build Agentune - SparkBeyond’s agent optimization platform, we will:
- Continue expanding our frameworks to evaluate customer-facing agents across their real KPIs
- Extend our insight-discovery benchmark to conversation-based data
- Use these tools to reflexively improve our Analyze and Improve components
so that agentune becomes a self-improving platform for self-improving agents.
Ideas for the next version of the benchmarking framework include:
- Adding conversational data
- Adding metrics for insight coverage for conversational data
- Adding metrics for semantic coverage of ground-truth insights
If you are building customer-facing AI agents and want them to optimize themselves over time, we’d love to exchange ideas.
#AI #AgentOptimization #ConversationalAI #SparkBeyond #SelfImprovingAI


About SparkBeyond
SparkBeyond delivers AI for Always-Optimized operations. Our Always-Optimized™ platform extends Generative AI's reasoning capabilities to KPI optimization, enabling enterprises to constantly monitor performance metrics and receive AI-powered recommendations that drive measurable improvements across operations.
The Always-Optimized™ platform combines battle-tested machine learning techniques for structured data analysis with Generative AI capabilities, refined over more than a decade of enterprise deployments. Our technology enables dynamic feature engineering, automatically discovering complex patterns across disparate data sources and connecting operational metrics with contextual factors to solve the hardest challenges in customer and manufacturing operations. Since 2013, SparkBeyond has delivered over $1B in operational value for hundreds of Fortune 500 companies and partners with leading System Integrators to ensure seamless deployment across customer and manufacturing operations. Learn more at SparkBeyond.com or follow us on LinkedIn.
Related Articles
It was easier in this project since we used this outpout
Business Insights
Apply key dataset transformations through no/low-code workflows to clean, prep, and scope your datasets as needed for analysis
Predictive Models
Apply key dataset transformations through no/low-code workflows to clean, prep, and scope your datasets as needed for analysis
Micro-Segments
Apply key dataset transformations through no/low-code workflows to clean, prep, and scope your datasets as needed for analysis
Features For
External Models
Apply key dataset transformations through no/low-code workflows to clean, prep, and scope your datasets as needed for analysis
Business Automation
Rules
Apply key dataset transformations through no/low-code workflows to clean, prep, and scope your datasets as needed for analysis
Root-Cause
Analysis
Apply key dataset transformations through no/low-code workflows to clean, prep, and scope your datasets as needed for analysis

